Automatic compression measurement using network analyzers
Introduction
The dynamic range of an amplifier is determined by noise figure and compression. In multi carrier applications third order intercept point is also essential. Conventional compression measurements are error prone and tedious. Multichannel and power sweep capability of modern network analyzers can be used to perform automated compression measurements. Power sweep feature also enables compression measurement of any arbitrary value. This is very useful in multistage amplifier design and comparison of amplifiers with similar output powers. One powerful feature of this automated measurements is, that amplifiers can now be tuned for compression by semi-skilled operators. The ease of measurements can enhance the quality and increase production.
1 dB Compression
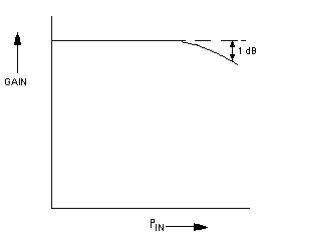
Compression is a measure of the linearity of a device. 1 dB compression is normally used as a standard of this measure. For an amplifier it is defined as the output power at which the gain decreases by 1 dB from the small signal gain.

1 dB compression is universally specified by amplifier vendors. This seemingly simple parameter is very tedious to measure and is error prone.
Conventional Compression Measurement
Conventional compression measurements are performed by switching a 10 dB attenuator from input to output and noting the gain change. The output power at which the gain differs by 1 dB is called output power at 1 dB compression.
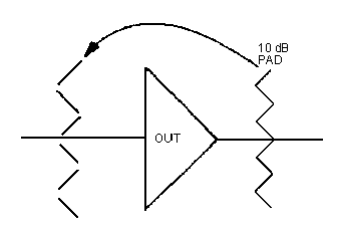
This set up eliminates the need for computing gains, but the input power has to be adjusted till the gains differ by 1 dB. This measurement needs few iterations and also involves twice as many connect, disconnect operations. When measurement over a band of frequencies are required, it takes innumerable iterations and connect, disconnect operations and the final results are basically a reflection of operators skill or fatigue.
Modern Compression Measurements
Thanks to advances in instrumentation, now power sweep is available in modern network analyzers and sweep oscillators. This feature enables compression measurements much more quickly and accurately.
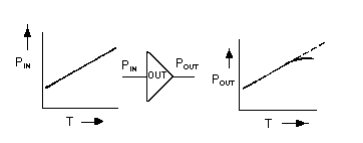
As shown in Figure 3, input power to the DUT is swept at a fixed frequency. In the linear range of the device, the output power rises linearly and starts deviating from linearity at compression. It is difficult to determine compression parameters in this mode. If the network analyzer is normalized with a through, then linear gain and compression can be seen clearly, as shown in Figure 4. But the troubles are far from over. One has to determine the output power at 1 dB compression. This is normally done by placing a marker at the compression point and returning the network analyzer to absolute power measurement mode and determine the output power.
Normally the output of the DUT is padded to prevent analyzer saturation and damage; in which case the attenuation of the pad has to be added to determine output power at 1 dB compression. When compression measurements are needed at several frequencies, this procedure is tedious as normalization has to be done at each frequency which again involves connect and disconnect operations.
Automated Compression Measurements
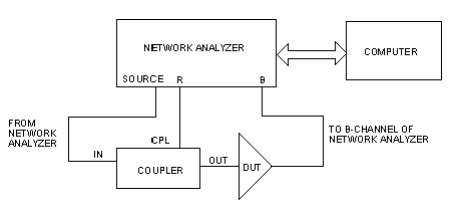
Power sweep feature of automatic network analyzers can be utilized in a novel way to accomplish accurate, automated compression measurements. Figure 5 shows the setup for automatic compression measurement. In this set up input power to the DUT is sampled and measured at the same time with the output power. If the coupler is pre calibrated, the input to the DUT can be computed in the computer and this enables gain to be computed as a function of the input power. From the computed gain values 1 dB compression can be determined.
Where Do You Get A Coupler
It is hard to get a coupler which covers the frequency range of the analyzer. Surprisingly, it is not necessary to look for one. All vector analyzers need a sample of the input signal to accomplish phase lock. This is done using resistive splitters and are part of Bridges or S-parameter set ups and are an integral part of the network analyzer. These bridges/S-parameter set ups cover the frequency range of the instrument and have excellent return loss. The sample output is also used in ratio measurements to eliminate error due to power changes. By pre-calibrating the coupler over the frequency range of measurement input power to the DUT can be determined by measuring power in the R-channel.
Effect of Bad Return Loss of DUT
Network analyzer couplers have good directivity. When the device return loss is bad, the reflected signal from the DUT gets sampled due to the finite directivity of the coupler and can result in errors of the order of magnitude of few tenths of a dB. This comes as error in gain. To increase the accuracy, an input attenuator can be added between the coupler and DUT. This increases the apparent directivity of the coupler by twice the value of the input attenuator or the return loss of the input attenuator, whichever is less. When they are comparable the vectorial sum of the signals reflected from attenuator and that reflected by the DUT and attenuated by the input attenuator arriving the coupler have to be considered. Normally, 6 to 10 dB attenuator will do the job. The drawback of this approach is, it decreases the available drive to the DUT.
Safe Attenuator At Output
With high drives, network analyzers are driven into compression which can result in measurement errors. With excessive drives the analyzer can be damaged. It is a good practice to add a "safe" attenuator at the output of the DUT to avoid these problems. This, even though it is a good practice, adds additional measurement steps. Attenuators have frequency response. To avoid errors with assumed safe attenuator values it is a good practice to measure the frequency response of safe attenuators and store it in computer. Normally this is done at low powers. Care should be taken to choose an attenuator which does not change attenuation value at high power.
Calibration Of Network Analyzer
Network analyzers are not basically designed for absolute power measurements. So, they have to be calibrated with power meters. It is a good practice to calibrate both B & R channels to avoid errors.
Step By Step Measurement Of Compression
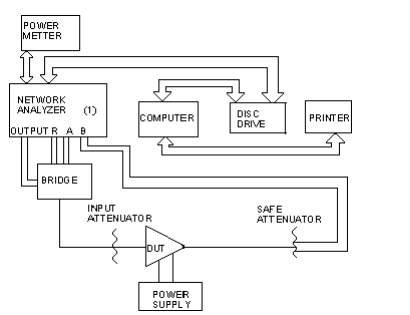
Figure 6 shows the complete set up for compression measurement of an amplifier using HP8753A automatic vector network analyzer. Step by step measurement of compression is as follows:
1. Calibrate B & R channels with power meter, store the correction factors in computer.
2. Connect B channel to input of Bridge. Keep network analyzer in frequency sweep. The difference in B & R channel readings gives the correction to be applied to R Channel power to obtain input to DUT. If DUT return loss is bad, have input attenuator while performing these measurements.
3. Connect Safe attenuator after input attenuator and measure its frequency response and store it.
4. Connect DUT as shown in figure 6. Set up instrument for CW frequency and power sweep. Apply power sweep. Read R & B channel powers. Apply correction factors to determine input and output powers as described above. Compute gain. Fine the output power at which gain drops by a dB from the lowest power. If I dB point is not found increase drive level Repeat measurement. If drive levels at low and at 1 dB compression point are less than 10 dB decrease lower end of drive level, repeat measurement.
5. Repeat step 4 at each frequency of interest.
All the decisions in steps 4 can be done automatically in the computer. These measurements do not involve repeated connect, disconnect operation and hence are very reliable.
Uses Of Arbitrary Compression Measurements
The strength of this procedure is compression point of any arbitrary value can be determined without an excessive number of measurements. This is useful in cascaded amplifier design when the contribution of each stage to the overall compression can be accurately determined.
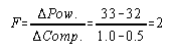
Compression measurement at arbitrary values of compression is also useful for system analysis. One important parameter called figure of merit of compression is defined as the ratio of change of power output to change in compression. For example, if the output power is 32 dBm at 0.5 dB compression and 33 dBm at 1.0 dB compression, then the figure of merit.
Conclusion
A novel adoption of the existing components of the network analyzer and the power sweep feature is used to automate compression measurements. Figure of merit is defined for compression which can be used to compare amplifiers of same output power for a particular application