A 10 MHz to 6 GHz Power Meter
This power meter, based on a Mini-Circuits ZX47 power detector, gives a direct display of -55 to +10 dBm power levels.
I was building the Modularized Spectrum Analyzer described by Scotty Sprowls. For detailed information about this spectrum analyzer, see www.scottyspectrum analyzer.com. I ran into a problem when I needed to align the analyzer. We are talking here about frequencies in the low gigahertz range. My frequency meter goes up to 3.5 GHz and would give a frequency reading but no indication of the power level involved. My 100 MHz scope couldn't cope and was useless. I needed two kinds of measurements:
- Relative ones: Am I getting any gain or loss? How much? Is the signal getting from point A to B?
- Absolute ones: Am I getting the 10 dBm I need from the phase locked oscillators (PLOs)?
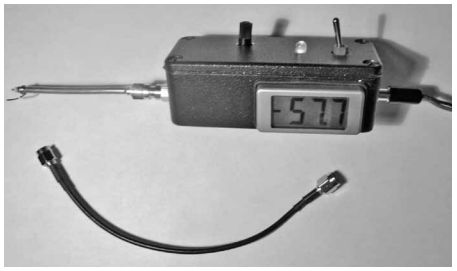
Remember that when making absolute measurements a sine wave shape is assumed. Also, all of the power coming out of the device must be measured: placing the probe in parallel when the device is delivering power to another device will not measure the true output. Most likely, and assuming 50 Ω impedances, it will measure 50% of the power. Use a pigtail as shown attached to the meter in Figure 1.
A Big Problem
With tiny (and I mean tiny) surface mount components, taking your eyes from the circuit to glance at a meter a foot or two away may result in the measuring probe slipping away, with disastrous effects; if not to the electronics, perhaps to yourself due to the adrenaline jolt. When measuring voltages I could bring my handheld DVM very close to the point of measurement to see the results, but not my heavyweight HP 435B power meter. I needed a hand-held device with local readout. This is particularly important in today's crammed circuits where you don't dare to glance away from the point of measurement for fear of the probe slipping.
The solution
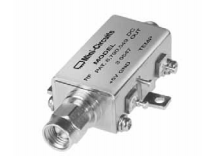
he solution I was looking for a way to enhance the "Pocket dBm RF Power Meter" by Steve Whiteside, N2PON in the August 2008 issue of QST, so it would measure into the gigahertz range. During that search I discovered the Mini-Circuits power detectors. See Figure 2. The Mini-Circuits ZX47 power detectors measure RF power from 10 MHz to 8 GHz and, depending on the detector chosen, -50 dBm to +15 dBm, displaying the results directly in dBm. This is especially convenient because with its small size, the readout can be at the place of measurement.
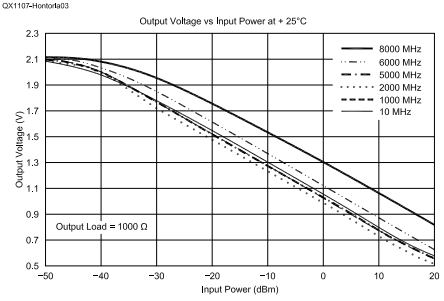
These devices are very linear, have a wonderful dynamic range and are tiny. Besides, their data sheets include response curves that allow for a close calibration without the need for an external reference. Figure 3 shows the output voltage versus input power response curves for the ZX47 -40+ power detector. I ordered one of them and ran a few tests to verify how close the response was to the published curves and found a general agreement of between 1 and 2 dBm. The detectors are not cheap (about $90 each) but they beat by a mile (and in some cases parsecs) the cost of commercial units.
Among other things, the combination of a VFO at 1013.3 MHz and this meter allowed me to set up the spectrum analyzer's cavity band pass filter to a loss of -10 dB in no time flat.
Mini-Circuits offers four detectors in its ZX47series. The linear span is approximately as follows :
- Model 60: -55 to + 0 dBm
- Model 55: -50 to +5 dBm
- Model 50: -45 to +10 dBm
- Model 40: -40 to +15 dBm
These ranges are good up to 6 GHz, but beyond that the range is smaller. Their output voltage is 0.6 to 2 V. Since its high power range may be increased by using an attenuator, my favorite is Model 60.
The schematic shown in Figure 4 is quite simple: one potentiometer sets the slope and the other sets the intercept of the response curves. Since - up to 6 GHz - the linear portions are essentially parallel, the slope pot is set once and left alone. As Figure 3 shows, the 8 GHz output voltage curve is quite noticeably different than the lower frequency curves, and would require a different calibration. The intercept is a function of the frequency and is set at the time of calibration or simply taken from the Mini-Circuits curves.
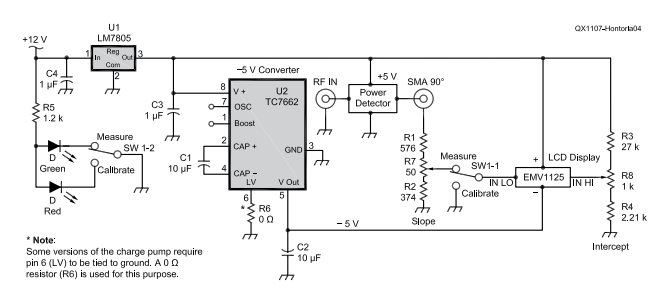
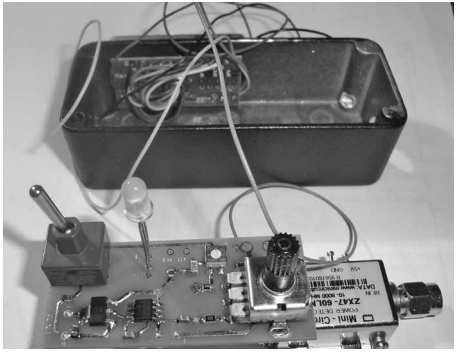
The user interface includes a Lascar EMV 1125 LCD digital voltmeter, a bicolor LED (red when the switch is in calibration mode, green when in measurement mode) and the offset potentiometer. A calibration table is pasted to the face of the box (not seen in any of the pictures). The offset potentiometer is set to the value in the table, which corresponds to the frequency of the signal being measured.
The meter requires an external supply from 12 to 20 V DC. Because of the sensor current draw (about 120 mA), no attempt has been made to use batteries
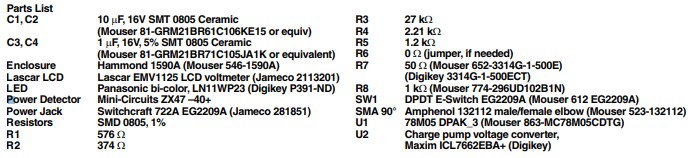
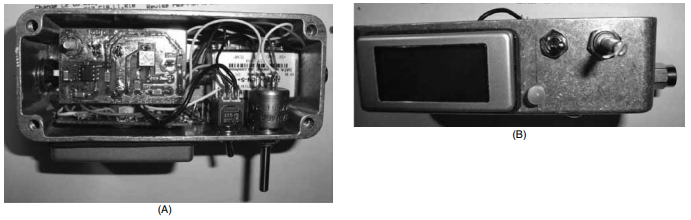
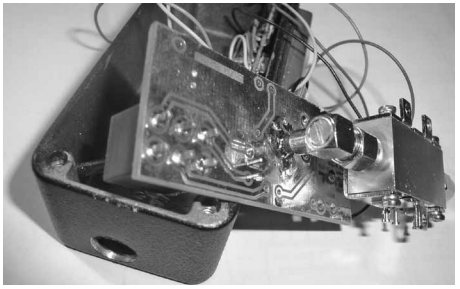
Figure 5 depicts my original unit. The left side of Part A has the 12 V jack. There was a 7805 voltage regulator bolted to the box floor underneath the circuit board and both the regulator and circuit board were secured by the screw visible at the top left corner of the circuit board. The IC visible on the circuit board is a charge pump to get the -5 V needed for the Lascar LCD voltmeter. I have built a newer version and have moved all the components to the printed circuit board. That has simplified the wiring. Figure 6 is a picture of the inside of the newer version.
Construction Notes
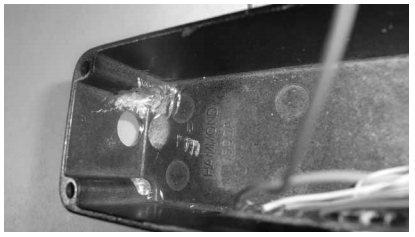
I used a Hammond 1590A cast aluminum enclosure, and had to remove some material from the corners to make room for the Mini-Circuits sensor, as shown in Figure 7. I center punched the area and then used my drill, being careful not to engage it and go through the wall. The probe SMA hole offset is to provide clearance for the LCD in the other side of the box. Not shown here, there was a hole drilled on the box "floor" to secure one of the legs of the sensor.
of the legs of the sensor. Look again at Figure 6. Some versions of the 7662 charge pump require that the LV pin (pin 6) be tied to ground to ensure a negative 5 V output of the same level as the positive input. Version 1.3 of the circuit board, which is the one shown in Figure 6, requires installing a wire jumper to ground. Circuit board version 1.4 has provision for a 0 Ω resistor (R6) if needed.
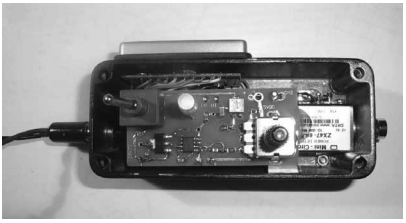
Figure 8 shows the Lascar LCD voltmeter control board on the inside of the Hammond project case, with the circuit board and power detector ready to be installed. Notice that the wires from the display feed through a hollow stud on the back of the display, and they attach to a row of holes along the top of the control board and to the switch and R8 on the circuit board.
Figure 9 shows the bottom of the circuit board, with a 90° angled SMA male to female connector between the detector output and main circuit board. I used a 1/4 inch length of 141 coax between the SMA female end and the circuit board. Do not solder the coax to the SMA connector until you are sure everything fits correctly.
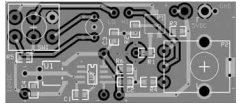
Figure 10 is the circuit board artwork. Note that this is a double sided circuit board, with the traces on top of the board outlined in black and traces on the bottom of the board shown in lighter gray.
The circuit board file was created using ExpressPcb. Because ExpresPcb requires a minimum board size of 3.8 x 2.5 inches, builders may want to join with a few others to make the price more attractive (a good club project?) or to include boards for other projects with the order. An alternative is to redo the design using Eagle.
A color copy of this artwork, along with the ExpressPCB file is available for download from the ARRL QEX files website: www.arrl.org/qexfiles. Look for the file 7x11_Hontoria.zip.
Drilling the Enclosure Cover:The potentiometer requires a 5 /16 inch hole. The LED I used requires 3 /16 inch and the switch needs a 1/4 inch hole for the shaft. Remember: "Measure thrice, drill once." Refer your measurements to the centers of the enclosure screw holes, not to its walls. Then, transfer those measurements to the cover.
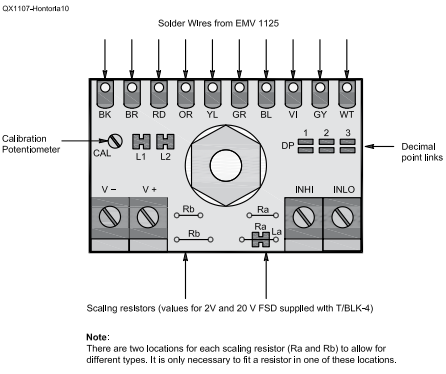
Setting Up the LASCAR LCD Voltmeter: The EMV1125 doesn't require a split rail power supply. It can happily run from a single rail. Under these conditions, however, the signal must be left floating (totally isolated) from the power supply and link L2 ties the floating signal (INLO) to a reference voltage (Com, held 2.8 V below V+). Since in the power meter the signal is not floating, link L2 must be cut. Leaving this link will basically short GND to V+, damaging the meter. Figure 11 shows the LCD voltmeter control board, with the connections to the display.
The meter is thus operated from a ±5 V split-rail supply. In order for the LCD to read 2 V full scale the Ra (910 kΩ) and Rb (100 kΩ) resistors must be installed and link La must be cut. To set the decimal point so that the meter reads directly in dBm, the decimal link DP1 must be shorted out.
Last, but not least, measure the input voltage at IN-HI with an accurate DMM and adjust CAL for the same reading on the Lascar display.
Preliminary Calibration
The preliminary calibration uses the Mini-Circuits data sheet curves. A more precise calibration will require comparison with another power meter. The following is how the preliminary calibration is performed.
If using the Lascar EMV1125, set it up in accordance with its data-sheet and the instructions above. If using any other meter, set it up to display 2 V, but move the decimal point to one decimal digit.
Refer to the schematic diagram in Figure 4. It refers to the designation of the potentiometers. This preliminary calibration procedure is based on setting the slope with R7 and the intercept with R8.
- Set the switch to "Calibrate" position, to ground the EMV 1125 input line; the bicolor LED should turn to red. Do not connect any signal to the RF input of the ZX47. Turn on the power supply.
- Use a DMM to measure the voltage at the ZX47 output (the top of resistor R1). Suppose you measure 2.17 V
- Adjust the slider of the slope potentiometer R7 (the small trimmer on the circuit board) and measure the voltage at the arm. For this example you should measure 2.17 V x 0.4 = 0.868 V
- I used the Model 40 Mini-Circuits detector, so I used the curves shown in Figure 3, reproduced from Mini-Circuits data sheet. Use a signal generator to inject a 10 MHz signal to the ZX47 -40+ RF input. Ideally, the signal level should be in the center of the range, which for the Model 40 is around -15 dBm. In any case, do not exceed the upper limit for the ZX47 detector you are using. Read the voltage at the input side of R1. Suppose you read 1.38 V.
- Look at the Figure 4 graph. The thin black line corresponds to 10 MHz and 1.38 V corresponds to -14 dBm.
- Set the switch to the "Measure" position; the bicolor LED will be green. Adjust the intercept potentiometer (R8) until you get the same dBm reading on the Lascar display. Return the switch to "Calibrate" and make a note of the reading on the display. That is your set point at 10 MHz
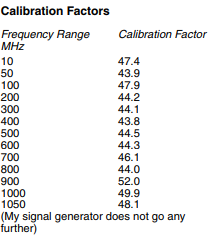
- Set the switch to "Measure" again, and you are ready to start measuring power in the 10 MHz range. You can now experiment with different frequencies and levels. For example, my set point at 50 MHz is 44.7, and at 1000 MHz it is 43.8. These set points are the equivalent of calibration factors used in other instruments. Table 1 shows the calibration table for my meter.
Background
With the Model 40, the response equation at 10 MHz is: dBm (10 MHz) = 42 - (40 x V) For example, a sensor voltage output of 1.3 V corresponds to a power input of 42 - (40 x 1.3) = 42 - (52) = -10 dBm at 10 MHz (the thin black line on Figure 3). For other frequencies, the response equations are: dBm (1000 MHz) = 41.7 - (40 x V) dBm (2000 MHz) = 39.25 - (40 x V) dBm (6000 MHz) = 44.7 - (40 x V) dBm (8000 MHz) = 52 - (40 x V)
Since the lines are essentially parallel (with the exception of the 8 GHz line) the slope has been set as a constant at 40. The intercepts are frequency dependent, however. Based on the Mini-Circuits graphs, the Model 40 power sensor should provide fairly close results to the above formulae between -35 and +15 dBm.