Methodology for Computation of Maximum Power Handling in LTCC Low Pass Filters
Purpose
The purpose of this application note is to describe the procedure used for determining power handling capability of LFCW-Series LTCC Low Pass Filters due to thermal-related failures.
Introduction
LFCW series filters are made using LTCC (Low Temperature Co-fired Ceramic) technology. Due to low losses and high temperature handling capability of the ceramic material, they can handle reasonably high power levels, even though they are of small size. Testing of power and thermal resistance is required to determine the maximum power handling capability.
Failure Mechanism
Applying RF power to the LFCW filters will generate heat due to Ohmic and dielectric losses and cause the rise of DUT temperature. LTCC technology uses thin layers of ceramic on which conductors are printed using noble metals. Various layers are bonded to each other by firing around 850°C. In actuality, the DUT is soldered onto a PCB. While the LTCC filter itself can handle very high temperatures, the weak point is the solder joint, whose melting point is much lower than 850°C. Therefore we use the solder melting point (with some margins) as the maximum allowable temperature of the DUT for maximum power computations. Assuming that the DUT is soldered onto a PCB using high temperature solder such as SnAgCu, whose melting point is 217°C, we can allow the DUT temperature to rise to 200°C without melting the solder joint. Note that the procedure described here can be used to compute max power for any user-defined maximum temperature.
Methodology Employed
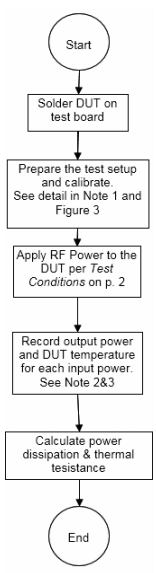
- Determine the thermal resistance of the DUT at a fixed frequency through thermal imaging measurements. See detailed flow chart in Figure 1.
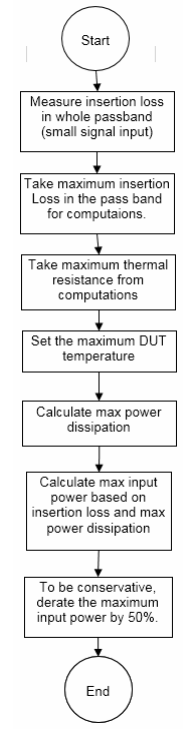
- Measure small signal insertion loss of the DUT in the pass band with a network analyzer.
- Use the highest insertion loss in the pass band and the thermal resistance determined from step 1 to compute the power dissipation, and in turn the temperature rise and the max power handling. See detailed flow chart in Figure 2.
Test Conditions
- Room temperature
- RF input: continuous wave
- Frequency = 4 GHz, see note 4
- Pin = 30, 33, 35, 36, 37, 38, 39, 40 dBm
Notes
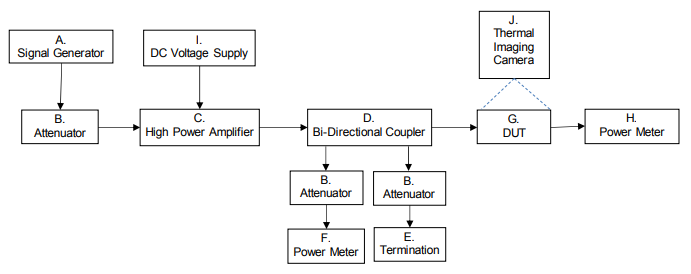
- Calibration method: zero & calibrate each power meter before test, connect the throughline of TB-720+ as DUT, and offset power meter F until it shows the same reading as power meter H at 4 GHz.
- Take thermal images after applying each power level for 5 minutes, or until the DUT temperature is stable.
- Record power meter F as input power Pin; record power meter H as output power Pout. Insertion loss = Pout - Pin.
- Choose the frequency at which you have a high power source. In this case, the test was performed only at mid-band frequency, 4 GHz.
Test Sequence
Test Data and Calculations
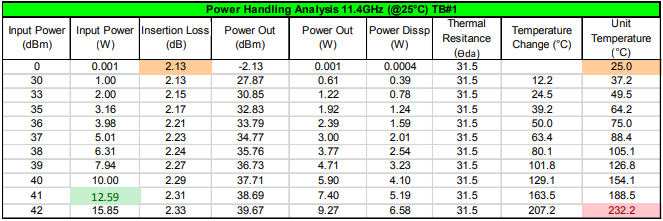
Below is an example of test analysis for filter model LFCW-1142+. Testing was performed at 4 GHz at room temperature, and prediction was made at 11.4 GHz based on the calculated thermal resistance, assuming thermal resistance is frequency independent.
Thermal imaging test for computing the Thermal Resistance of DUT
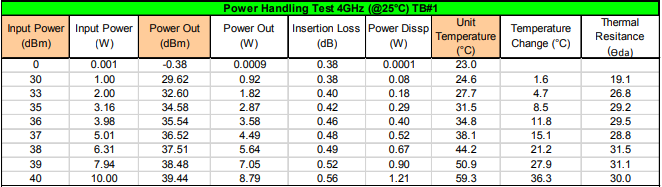
Calculating the max input power at room ambient temperature, 25°C. To be conservative, we choose the max thermal resistance to do the calculation
Calculating the max input power at 100°C ambient temperature
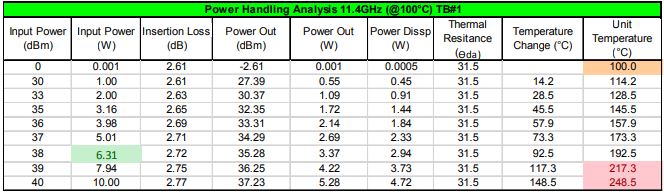
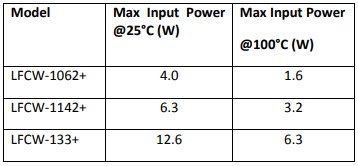
Table 2 below shows the final results of maximum power for models LFCW-1062+, LFCW-1142+, and LFCW-133+.
Max Power Computation at User-Defined Maximum DUT Temperature
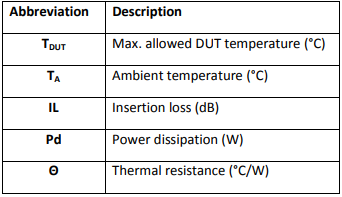
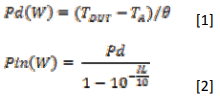
Equations [1] and [2] below can be used to compute maximum power at any maximum DUT temperature defined by the user.
Conclusion
The method for testing of power handling demonstrated in this application note feasibly predicts the maximum power rating of LFCW-Series low pass filters. Analysis shows that the model with less pass band insertion loss exhibits a higher maximum power rating.