Wide Modulation Bandwidth Measurements
Introduction:
Frequency of a voltage controlled oscillator is proportional to the amplitude of the tuning voltage. Hence, it can be treated as an FM modulator. Every VCO has a tuning voltage range specified. When the tuning voltage is changed at a slow rate, the VCO responds to the voltage changes faithfully. When the rate of change of control port voltage is increased, the VCO frequency may not follow as faithfully. The frequency deviation produced for a given voltage swing reduces as the frequency of the control voltage increases. The frequency at which the frequency deviation reduces to 0.707 (or -3dB) of the DC or low frequency value is a measure of the frequency response of the control port. As the frequency response of the control port is low pass in nature, it is equal to the 3-dB modulation bandwidth. Measurement of the wide modulation bandwidths is not an easy task. Many of Mini Circuits VCOs have very wide modulation bandwidths, which is useful in angle modulation communication systems. This application note explains the theory and the method of measurement of wide modulation bandwidth.
Theory:
Let a DC voltage be applied to the control port of the VCO. This results in a frequency f0. Now apply a sinusoidal voltage of frequency fmod and amplitude vmod on top of this DC voltage. This result is an FM modulated signal at the output of the VCO and is given by:
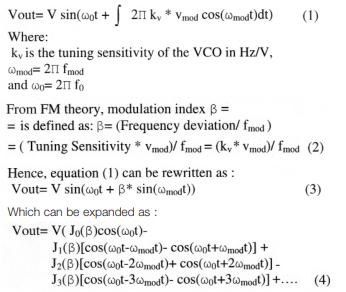
As can be seen from equation (4), the output of the VCO may consist of a carrier signal f0 and sideband signals spaced at n*fmod on either side of the carrier, where n is an integer.
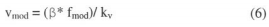
The amplitude of the sideband signal is proportional to the nth order Bessel function Jn(ß) and is given by:
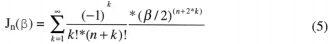
The carrier amplitude is proportional to the J0(ß), the first sideband amplitude - to the J1(ß), etc.
In an ideal VCO of infinite modulation bandwidth, if the amplitude of the modulating signal and fmod are increased proportionally to keep the ratio vmod/ fmod constant, the modulation index will remain constant and so will the amplitude of the carrier and sideband signals. In practice, this does not continue indefinitely. As the frequency response of the control port of the VCO starts to become affected, the modulation index starts decreasing or the effective deviation of the modulating signal is decreasing. When it is 0.707 of the initial "slow" deviation value, we have effectively reached the 3dB response of the control port. Properties of the Bessel functions along with the principle described is used in the modulation bandwidth measurements.
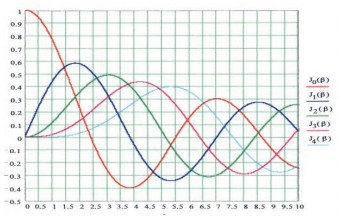
Fig 1 shows a plot of the Bessel function for various values of "n" as function of the modulation index. As can be seen in fig 1, the carrier amplitude is equal to zero when the modulation index is approximately equal to 2.4. This feature is very convenient to use as the specific reference point and it is used in method 1 of the modulation bandwidth measurements.
METHOD 1: Block diagram of an experimental set up is shown in fig 2.
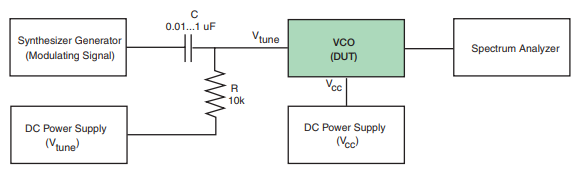
A modulating signal is applied to the DUT along with a quiescent DC voltage. DC power supply feeds the Vcc. Rearranging equation (2), we get
The output of the VCO is applied to the Spectrum Analyzer. The frequency of the modulating signal is set to at least a tenth of the anticipated modulating bandwidth.
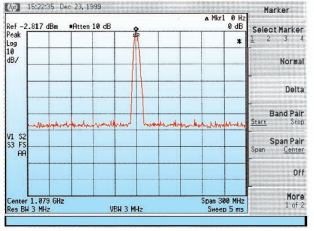
In the experimental set up in fig. 2, turn off vmod and adjust the spectrum analyzer display to set the carrier to the top of the spectrum display. See fig 3 for an example.
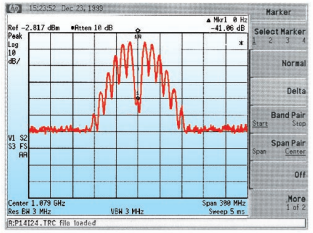
Now, set the fmod to a tenth of the anticipated 3dB modulation bandwidth. Calculate the amplitude of the vmod required to achieve a modulation index of 2.4 from equation (6) and set this amplitude. The carrier should be suppressed completely. If required, fine tune the vmod until the carrier is completely suppressed. In practice, a 30 dB suppression is good enough. This should correspond to a modulation index of 2.4.
See fig. 4 for a typical spectrum display at this condition.
Now, the task is to find the modulating frequency which degrades the modulation index to 1.697 (0.707 of 2.4). Slowly increase the modulating frequency and the amplitude of the modulating signal keeping the ratio of vmod/fmod constant. As the 3dB modulation bandwidth is approached, the modulation index starts degrading and this results in increase of the carrier. When the modulation index is equal to 1.697, the carrier level (equation 3) is 0.4 or it is -8dBc with the reference to the unmodulated carrier (see fig 5).
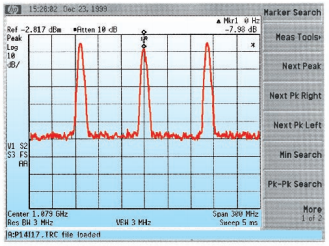
At this time the modulating frequency is numerically equal to the modulation bandwidth, as the frequency response is assumed to be low pass in nature.
If the selection of the initial frequency is wrong, erroneous results may be achieved. This is true especially if the initial frequency is too close to the 3dB frequency. To prevent this, repeat the above measurement at half the initial value. If the results are within measurement error, good measurements are made.
Alternate methods:
METHOD 2:
Set the vmod/fmod to get a modulation index of 2.4 to get carrier suppression as in method 1. Now increase the amplitude of vmod by 1.414 to get a modulation index of 3.4. Then increase fmod, and vmod keeping the ratio constant. When the modulation bandwidth is degraded by 0.707 to 2.4, the carrier is fully suppressed and 3dB bandwidth has been reached.
METHOD 3:
Other properties of Bessel functions can be used to do the above measurements. For example, start with a modulation index of 1.44. At this point, the amplitudes of the carrier and the first order sidebands should be equal. Now measure the amplitude of the modulating signal and increase it by 1.414 times (inverse of 0.707) of the measured value. This increases the modulation index by 1.414. Now increase the amplitude of the modulating signal and the modulating frequency simultaneously, keeping the ratio constant. When the 3 dB frequency has reached, the carrier and sideband amplitudes are equal again.