Statistical process control... key to competitive manufacturing
In today’s tough world market environment, the need to be better is more demanding, and the need to be more competitive is a necessity to survive. A company cannot rest on the success of past performance and expect to continue to remain successful. There are many well known examples of companies both large and small that were once leaders in their field and now are skeletons of themselves or just plain dead and buried.
How does one get more competitive? The answer is simple. Exceed your customers’ needs and expectations...provide, in the manner required by the customer, a quality product at low cost, on time, every time. In most manufacturing organizations a significant cost factor is attributed to the cost of purchased materials and they may range from 25% to 80% of the cost of the entire product. Because of the significance of purchased material to total cost, the quality of the purchased material is important and essential to the competitiveness of the manufacturing organization.
This paper will discuss the effects of quality on the direct and indirect causes that contribute to the real cost of the purchased material. A measure of the quality of the material will be described by a quality factor, Cpk. The higher the value of Cpk, the better the quality of the product. Cpk is a measure of the repeatability of material performance. The higher the number, the better is the consistency of performance or the less is the variation in performance. Therefore, once designed in, the material should be consistent enough so that its variations are not transparent to the final product.
In manufacturing, variation is evil! If the value of Cpk for a purchased part is low, and Cpk varies from production lotto-lot, then it can be projected the process for manufacturing the part is not in control, performance will be inconsistent, rejects can be expected, and the true cost of the purchased part will be significantly higher than the price shown on the purchase order.
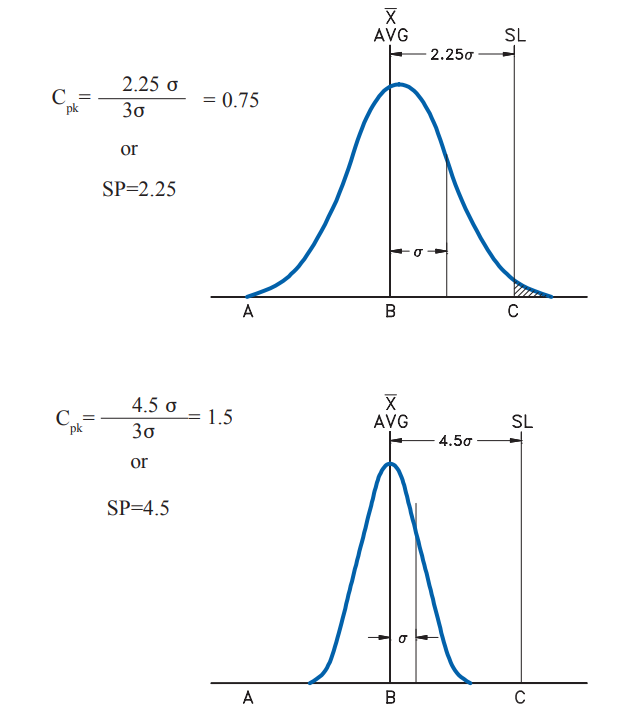
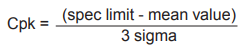
With the abundance of low cost computers and hand held scientific calculators, the ability to calculate Cpk is easily attainable. Cpk is a quality factor that is based on the statistical calculation of mean value, x and standard deviation, sigma. Cpk is the difference in value between the mean value and the closest spec limit divided by 3 sigma.
At Mini-Circuits we use SP (Sigma Performance) = 3 times Cpk. We must measure variation to control it. If we can measure it we can tell when it gets better or worse. We need to know what works and what doesn’t work. How much a manufacturing process varies is measured by Sigma (σ). In the figures shown, the average (AVG) tells us where the process is centered. The spread or width is measured by sigma. The figures show how the product is distributed. The height of the graph measures how often values occur. The spread measures how far the values are from the AVG. If the product is well controlled, there will be little variation, more values of units will occur nearer the target, x, and sigma will be small.
Manufactured products are either good or bad depending on whether they do what the customer wants them to do. Specification limits were the measure of success, where product within spec was good and out of spec bad. It is not enough in today’s market place to just meet spec! In the figures shown, a spec limit (SL) is compared to the product distribution. Product built outside, or to the right of the spec limit, is very bad; even product built just to the left of the spec limit is not good. Small (skinny) Sigma means the product will be far from the spec limit and close to the AVG value (very good product, what today’s customers demand).
We can compare different processes by measuring variation and the distance from the average to the spec limit. But only if we measure the distance in terms if sigma, as shown in the figures. The real distance is the same for both figures (C-B), meaning both processes are centered and the AVG values are equal. But, in terms of product quality, the figure on the bottom is far superior (4.5>2.25) because the variation between units is much less as given by the skinnier value of sigma.
For convenience, we normalize by dividing the distance (C-B) by sigma (considered a relative ideal), and get the capability index, Cpk, a figure of merit. The skinnier the σ is, the higher the Cpk, and the less variation, unit-to-unit.
The “goodness” of the purchased parts, Cpk, will affect the actual real cost of the purchased material. This real cost can vary and will depend on the original design and the specifications describing the purchased material. The real cost depends on the sum of both direct and indirect costs. These are:
Costs additive to the cost of purchased parts:
A. Direct costs of poor quality parts: ect costs of poor quality parts:
- Warranty
- Scrap and repair
- Inspection/test
B. Indirect costs of poor quality parts: ect costs of poor quality parts:
- Lost sales-customers switching to competition
- Field trips, retrofits, settlements
- Downtime, line shut downs, delinquencies, rescheduling
- Inventory build-up, obsolete material, MRB, material expediting, material shrinkage
- Engineering changes and redesign, documentation changes, material selection and separation
C. Indirect costs, demands of the manufacturing system on company’ system on company’s resources:
- Space
- Manpower, receiving, production control, manufacturing, sales, finance, engineering, QA, accounting, maintenance, house cleaning
- Utilities (lighting, heating, air conditioning, telephone)
- Capital equipment (testing, incoming inspection and production, data processing)
- Finances, cost to maintain higher inventory of material
- Data processing and data entry
Description of costs to the manufacturer of poor quality parts received.
When poor quality parts are received, the manufacturer must maintain an incoming inspection department to check parts for conformance to specifications. If all parts were received with a Sigma Performance = 4.5 or, Cpk =1.5, then the demands for incoming inspection would evaporate. However, this is not the case in the real world today. Therefore, the cost of the inspection department is visually spread out and amortized as a percentage of the total cost of all material received. However, when poor quality parts are received, there are direct additional costs that are incurred by the manufacturing organization. These costs include additional testing and inspection so that additional manpower and capital equipment are required. In addition, there are added costs associated with documents DMR, RTV etc.; MRB meetings; purchasing costs such as expediting, search for alternatives, rescheduling and issuing of p.o. change orders; and engineering costs for evaluation and test.
In addition to incoming inspection costs, the delays of incoming material to the production floor will generate additional manufacturing costs. These include rescheduling and smaller production runs (less parts available); inefficiency of resources, such as manpower and machines, increased space requirements and WIP; increased material shrinkage and increased manufacturing throughput time.
The results of these manufacturing delays and costs will cause shipment delays and increased manufacturing costs that may be passed on to customers. Both factors contributing to a less competitive position!
To pursue Mini-Circuits’ goal to exceed our customer’s expectations, Mini-Circuits is striving to achieve an SP of 4.5 or, Cpk = 1.5. All mixer and I&Q modulator conversion loss is specified in statistical terms. We are vigorously pursuing statistical process control and statistical specifications on all our products to enable our customers to receive the highest quality and value, at the lowest cost...the key to competitive manufacturing.