VCO test methods
HOW TO MEASURE OUTPUT POWER AND FREQUENCY
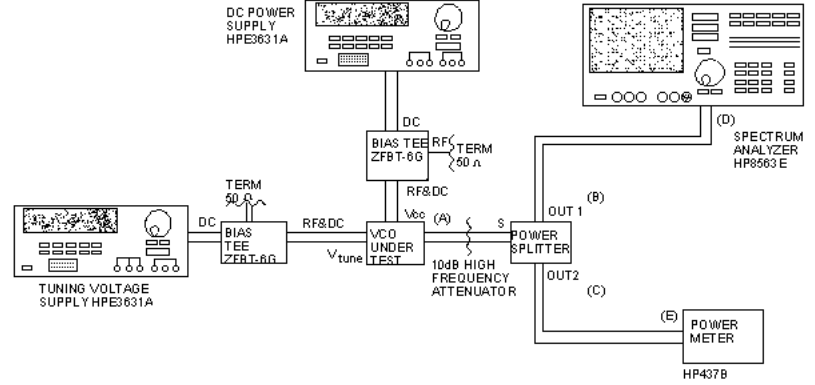
Figure 1 is a block diagram of the setup for this measurement. Well regulated power supplies are recommended for tuning and VCO supplies. Bias Tee's in the DC and tuning voltage lines help reduce the power supply noise. The VCO output A is divided into two signals B and C. The signals B and C are connected to the spectrum analyzer D and power meter E respectively. Modern spectrum analyzers, such as HP8563E have sufficient accuracy for measuring frequency, and this spectrum analyzer is used for frequency measurement. The span and resolution bandwidth is set appropriately for the measurement. The system is calibrated by measuring the insertion loss of the RF path from A to E as a function of frequency. These insertion loss measurements are used to compute the actual output power of the VCO. The VCO frequency is changed by changing the tuning voltage. For different tune voltages the VCO output power is read from the power meter. The frequency is read from the spectrum analyzer using peak search function. A computer attached to the system can be used to automate the measurements.
HOW TO MEASURE TUNING SENSITIVITY AND LINEARITY
Tuning sensitivity is defined as the frequency change per unit volt of tuning voltage. The setup shown in Figure 1 can also be used for this measurement. For different tune voltages, the VCO frequency is read from the spectrum analyzer. The frequency measurements are plotted against the tune voltage. The slope of this characteristic is the tune voltage sensitivity and can be calculated at different tune voltages. The data can also be used to calculate the linearity as defined in Application Note 1. A simple program can automate this measurement.
HOW TO MEASURE HARMONICS AND SPURIOUS LEVEL
VCO's are normally operated under high nonlinearity, and therefore generate harmonics. The setup shown in Figure 1 can also be used for this measurement. The harmonic level is measured relative to the fundamental signal level. A marker is placed on the fundamental signal and, using delta marker, the harmonic levels are measured relative to the fundamental signal. A simple program can also automate these measurements.
HOW TO MEASURE FREQUENCY PUSHING
Frequency pushing is caused by the VCO's sensitivity to supply voltages. Pushing is a measure of the sensitivity of the VCO output frequency to supply voltage and is expressed in MHZ/volt. The setup shown in Figure 1 can also be used for this measurement. The supply voltage is set at its nominal setting and the VCO frequency is recorded for different tune voltages. Next, the supply voltage is increased by 1 bolt and the VCO frequency is measured for different tune voltages as before. Lastly, the supply voltage is decreased by 1 volt from the nominal, and the frequency is measured for different tune voltages once more. At a given tuning voltage, the frequency change due to 1 volt supply voltage change gives the pushing. It may be different at different tuning voltages. A simple program can also automate these measurements.
HOW TO MEASURE FREQUENCY PULLING
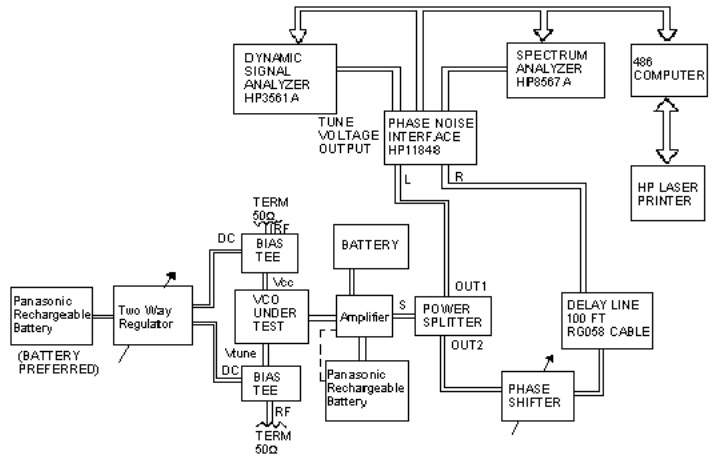
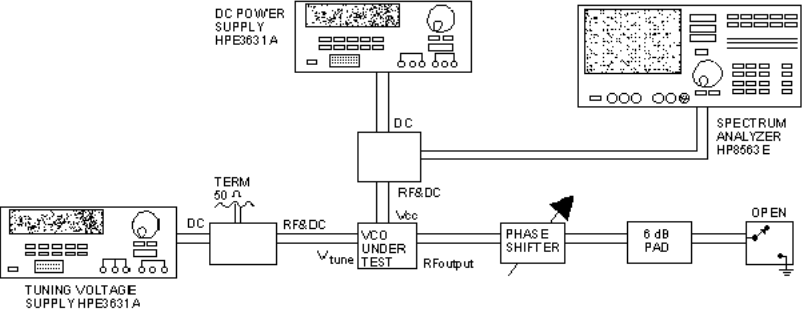
Frequency pulling is a measure of the frequency change due to a non-ideal load. It is measured by noting the frequency change caused by a load having a nominal 1 2dB return loss with all possible phases. Traditionally used low loss coupler may be avoided if monitoring signal is taken from Vcc bias tee. This reduces additional error because of the main line coupler loss. The RF leakage of the VCO to the Vcc port is enough to monitor the frequency. Figure 2 shows the setup for this measurement. Pulling may be different over the operating frequency band, and may need to be measured at several points in the operating bandwidth. The spectrum analyzer output frequency is set to the VCO output frequency. The measurements consist of the following steps:
- Tune phase shifter to get the maximum (or minimum)frequency with short on the end of the poutput line.
- Use peak search and normalize marker to zero.
- Change reflected phase by 180° by switching short to open.
- Fine tune phase shifter to get to minimum (or maximum).
- Use peak search and read the frequency pulling value.
In a case where the VCO output frequency is too low, a continuously variable phase shifter cannot be obtained. Only the short-open technique may be used as an approximate method to measure pulling.
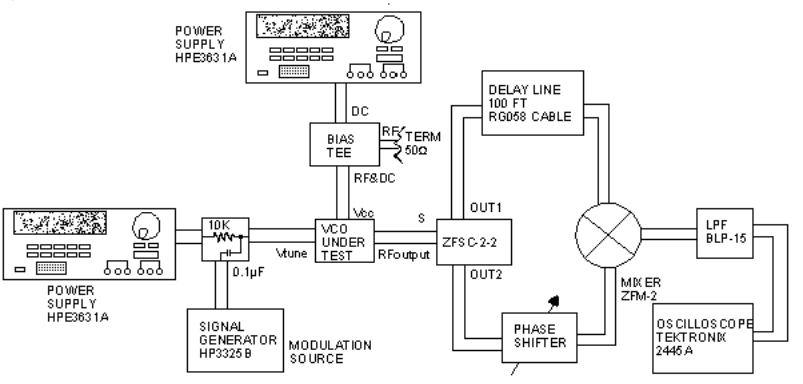
HOW TO MEASURE MODULATION BANDWIDTH
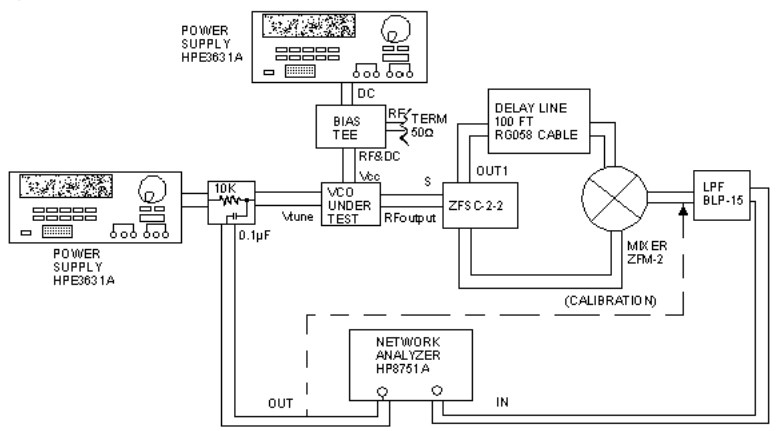
Modulation bandwidth is a measure of tuning port frequency response. It is measured using the setup shown in Figure 3(a). The principle of measurement is by modulating the VCO with a sine wave, then using a demodulator to demodulate the original modulating signal. If the frequency response of the demodulator is broad enough, this technique is good for characterizing the frequency response of the modulation port. The discriminator is obtained by using standard Mini-Circuits parts as shown in the Figure. The VCO output is divided into two parts using a power splitter. The mixer ZFM-2 acts as a phase detector and demodulates the FM modulated signal. The output signal is applied to an oscilloscope through a low-pass filter (BLP-15). The frequency of the modulating signal, keeping the amplitude constant, is varied starting from a frequency very close to DC until the oscilloscope display drops by 3dB, or to 0.707 of its low frequency value. This frequency is recorded as the 3dB modulation bandwidth. In order to automate this measurement, a low frequency network analyzer can be used to replace the modulating source and the oscilloscope. Figure 3(b) shows this setup.
MODERN METHOD OF VCO MEASUREMENT
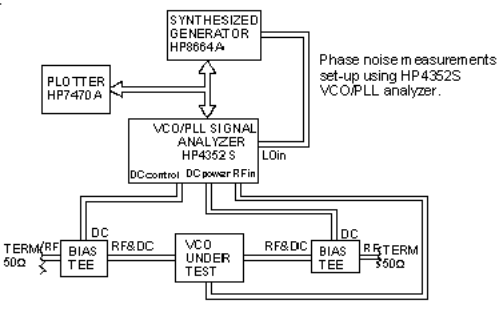
HP has recently introduced a powerful VCO/PLL test system, the HP4352S. It has built-in low noise power supplies and is available for VCO testing. It measures VCO characteristics such as frequency, tuning linearity, output power, and harmonics as a function of tuning voltage. It can also be used to measure pushing, output power vs. Vcc, phase noise at a given offset vs. VtUne or Vcc, etc. The instrument is user friendly and does not need calibration. A set up using this instrument is illustrated in Figure 4.
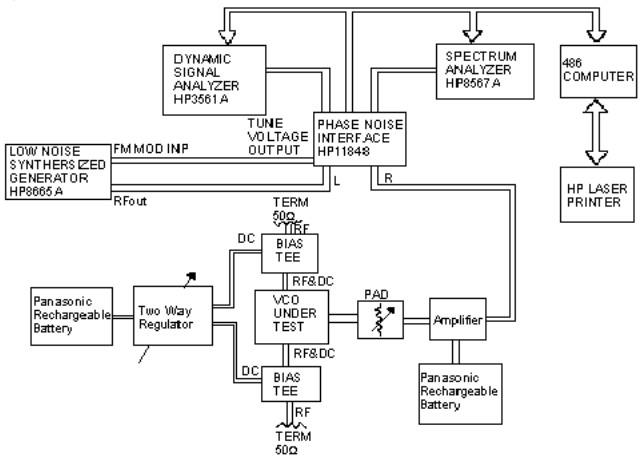
HOW TO MEASURE PHASE NOISE
Phase noise represents the short term stability of the oscillator. Refer to Application Note 2 for details. The standard industry method of measuring phase noise is by the use of HP 3048A Phase Noise Analyzer. Depending upon the noise level, either PLL (Figure 5) or discriminator method (Figure 6) should be used. Batteries are used for Vcc and tuning voltage. This will minimize noise contribution of DC power supplies. Bias Tee (such as Mini-Circuits ZFBT-6GW) are recommended to get additional clean up of supply noise. In the PLL method, an external low noise reference oscillator is used. Noise floor of the external oscillator should be lower than the oscillator under test. Therefor, this method cannot be used for very low noise measurements, and the discriminator method should be used instead. The noise floor improvement is a result of elimination of external reference. This method is useful in measuring lower noise at higher ofFset frequencies. In general, noise measurements using HP 3048A are complex, and needs a qualified and trained operator. Luckily, new instruments such as HP4352S ffrom HPTM), and NTS-1000A (from RDLTM) simplifies the task. HP 4352S employs PLL method, and therefore has a limited noise floor. However, it still satisfies the requirement for a vast majority of applications. It is also useful in measuring other parameters of the VCO. NTS-1000A uses discriminator method, has a better noise floor, and is suited for low noise measurements.